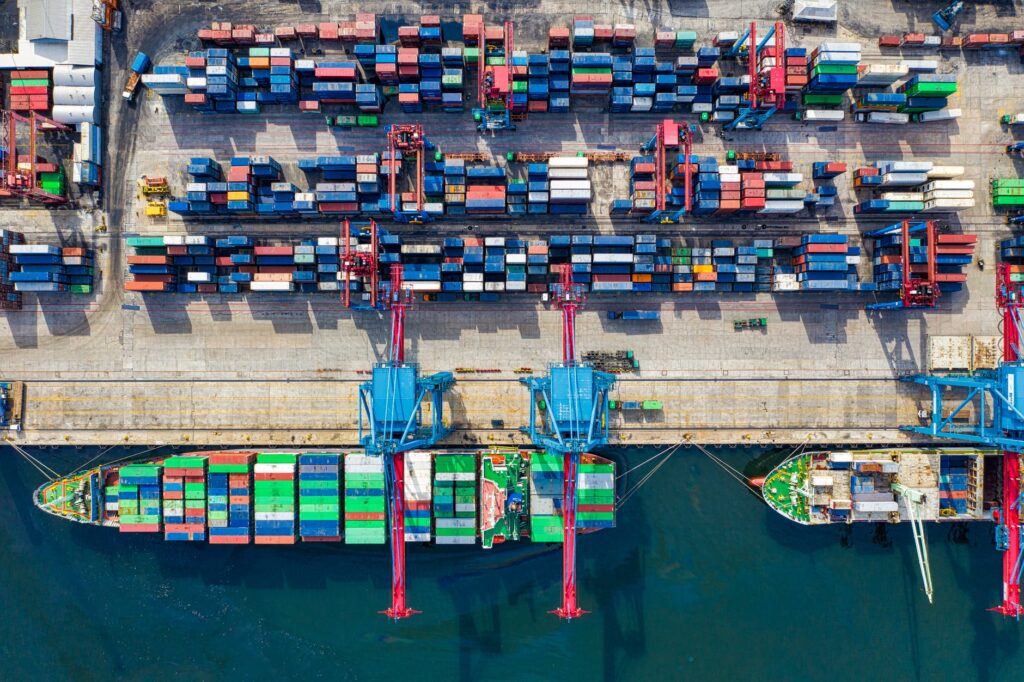
Foreign trade is undoubtedly a very important component of economic development of countries. The increasing importance of trade activities in the international dimension is fostered by the globalization processes of the world economy. According to the latest CSO data on foreign trade for the period January-November 2020, the value of trade in imports amounted to 909.8 billion PLN. In turn, the value in exports amounted to PLN 960.8 billion. Thus, Poland recorded a positive balance in foreign trade at the level of PLN 51 billion. Compared to the same period in 2019, imports fell by 3.3%, which is good information. Read the article to the end and find out how the import of products to Poland looks like.
Where do products come to Poland from?
Poland has the largest share in imports with developed countries – 64.8% (including EU 55.1%). Next are the developing countries (29%) and at the end the countries of Central and Eastern Europe (6.2%). The top countries from which we import (according to the country of origin, i.e. the country where the goods were manufactured, processed or reworked and in this state came to the Polish customs territory) the most goods are: Germany (PLN 198.2 billion), the Czech Republic (PLN 131.5 billion), Italy (PLN 45.1 billion), Russia (PLN 41.2 billion) and the Netherlands (PLN 35.7 billion). The top ten of our trade partners included two countries outside of Europe. These are: United States (PLN 28.2 billion) and South Korea (PLN 21.8 billion). Turnover with the top ten countries accounted for 64.1% of total imports (compared to 63.8% in January-November 2019).

Product imports to Poland – What do we import?
We import the most to Poland: machinery, equipment and transport equipment (35.8%), industrial goods classified mainly by raw material (16.4%). Next are: chemicals and related products (14.7%), various industrial products (14.5%), food and animals (7.8%). At the very end were mineral fuels, lubricants and related materials (5.3%). In imports, the largest increases were recorded in: oils, fats, waxes, animal and vegetable (by 23.2%) and beverages and tobacco (by 16.9%). This was followed by: food and live animals (up 6.6%) and miscellaneous manufactured goods (up 5.7%). The largest decrease was observed in: goods and transactions not classified in the SITC (down 39.4%) mineral fuels, lubricants and related materials (down 31.1%). non-edible raw materials except fuels (down 6.5%), machinery and transport equipment (down 4.8%), and industrial goods classified mainly by raw material (down 3.6%).

